
Accessibility: Images, Graphs, and Charts
Click the back arrow or here to jump back to the Making Content Accessible at ARC page.
Making Images, Charts, and Graphs Accessible
There is no doubt that visual information is a helpful and sometimes necessary element of instruction.
There are many types of visual information and the W3C Web Initiative Project has a great explanation of how to make each type accessible, depending on its purpose in their Images Tutorial. Working through the W3C Images Tutorial is probably the simplest resource to help you make any visual information in your course accessible.
There are different ways to make images, charts, and graphs accessible for all of your students:
Alternative text (Alt-text)
Alternative text (alt-text) is information hidden in the HTML code of an image or picture. The good news is that most word processing programs or software allow for you to add alt-text without needing to know how to write and edit HTML code.
- How to add alt-text in Microsoft Word or PowerPoint | Excel
- How to add alt-text in Google Docs | Sheets | Slides
Alt-Text Guidelines
- Keep it short (less than 125 characters).
- Be descriptive of the purpose, not the content.
- Don’t include “image of” or “picture of” – this will already be announced with screen readers.
- Leave alt text blank if the image is purely decorative.
- Text in an image should always be part of the alt-text description.
- If the info in the image is already on the page, do not include alt-text.
- Use punctuation.
Long Descriptions
When you are unable to capture the intent or information of an image in the alt-text attribute (i.e. exceeds 125 characters) you may need to include a long description.
- Include alt-text for images even if a long description is required.
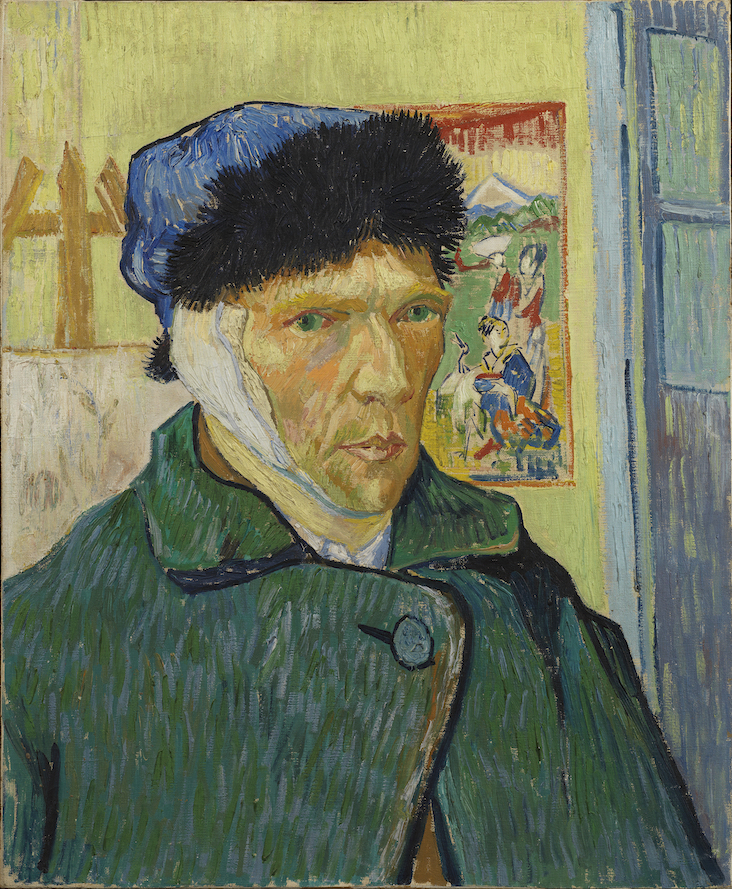
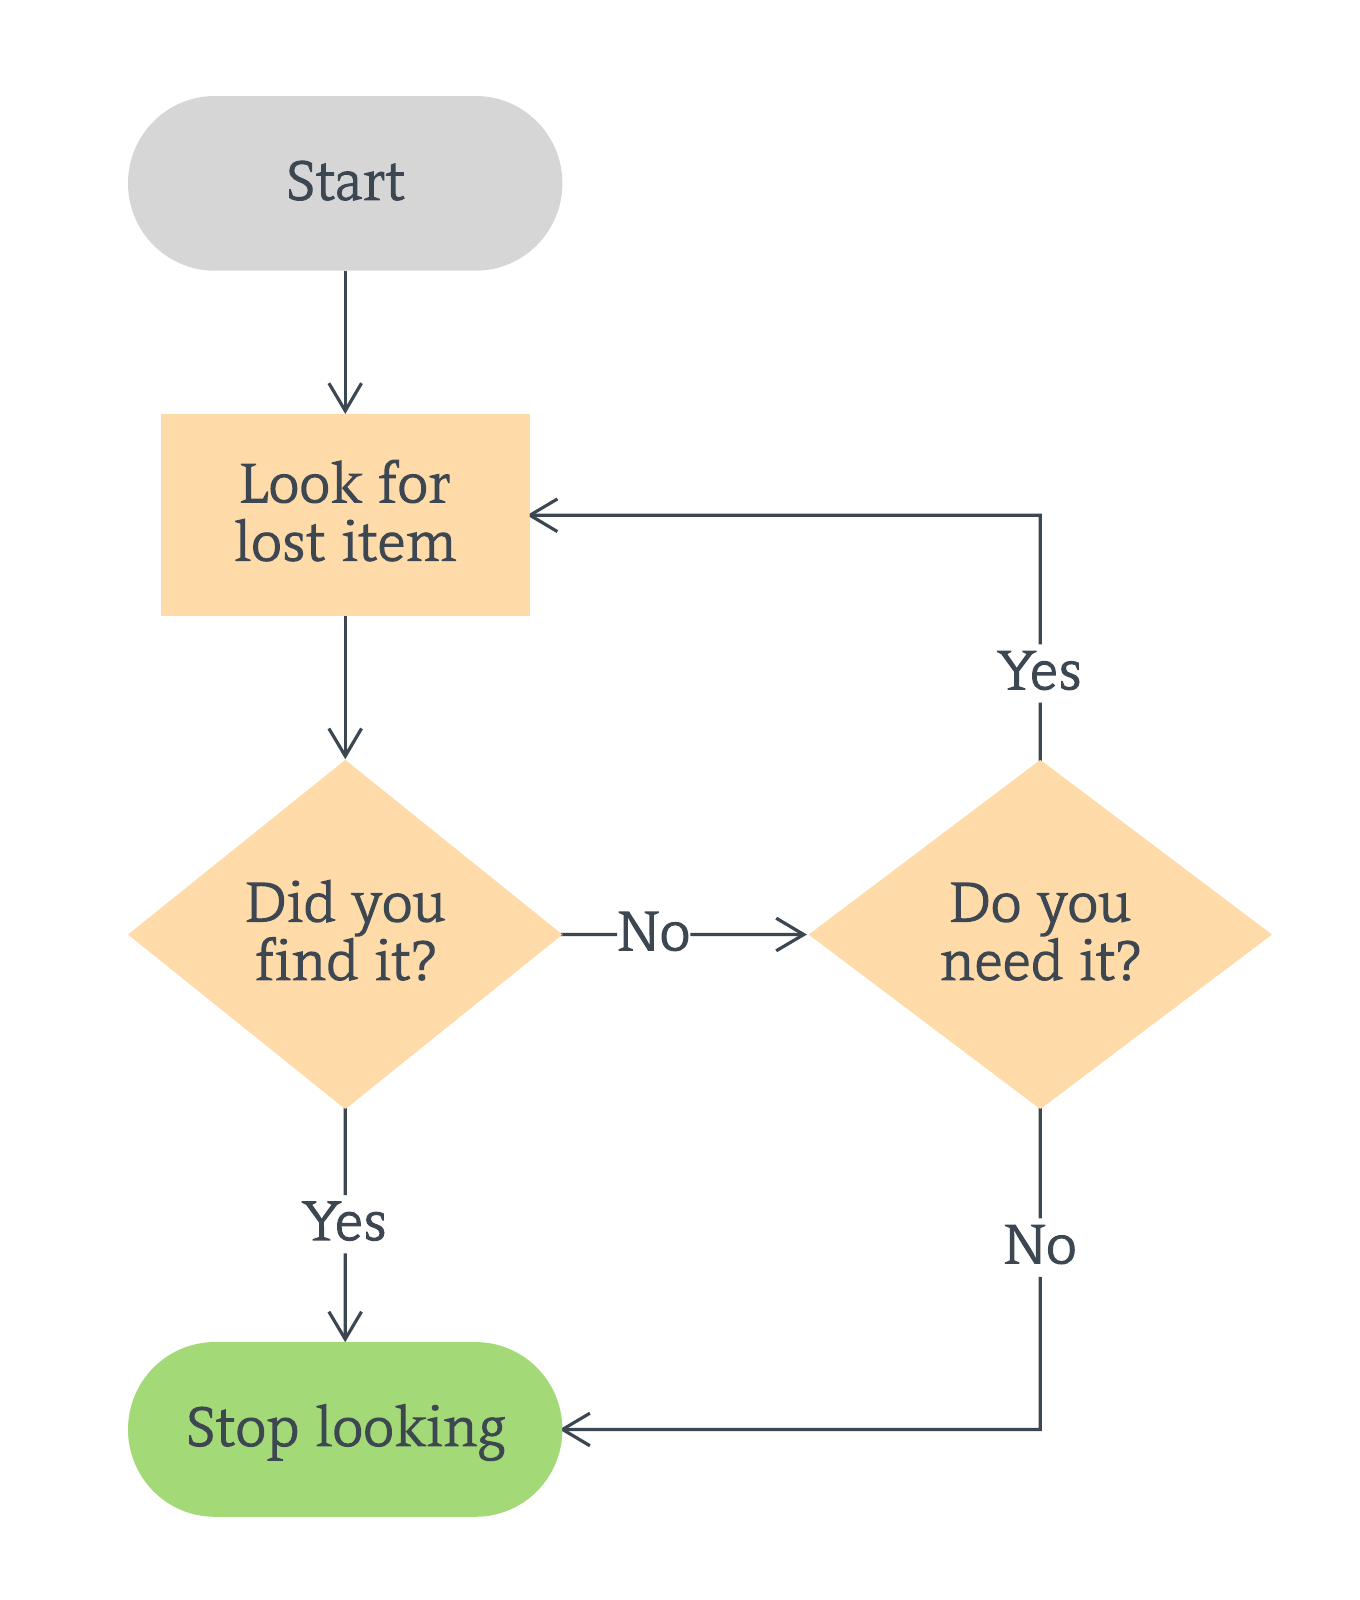
There are many types of complex images that might require a long description:
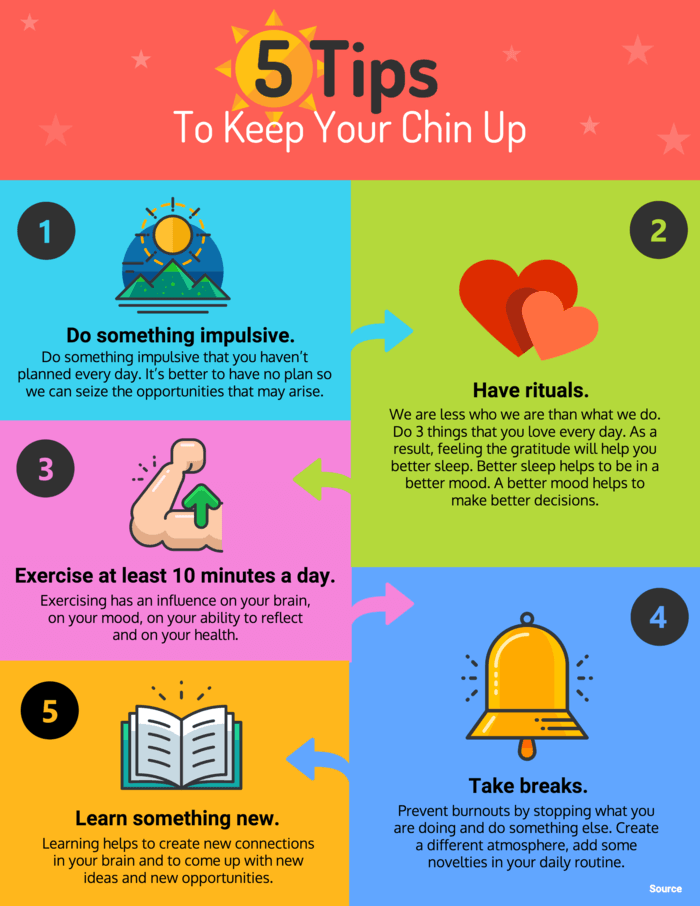
The long description should be appropriately formatted and be placed directly next to the complex image or it can by hyperlinked to another location (e.g. page in Canvas, invisible slide in presentation, separate document, or at the bottom or end). Be sure that any hyperlink to a long description has a quick and easy path back to the image.
Using AI for Long Descriptions
There are some AI image description generators that you can use to help write a long description for a complex image; just be sure that you use these with the same academic integrity that you would expect of your students. However, just be sure that you carefully review the output to ensure that the long description is in fact capturing important information in the complex image. Although there are many AI tools, check out the Image Accessibility Generator (Arizona State University).
Important: Review all AI generated output to ensure that it captures the instructional intent of the visual image. Always review, review, review any AI generated output.
Alternate Formats
Sometimes a long description is also insufficient and in those cases providing the visual information in an alternate format is required to ensure accessibility for all of your students.
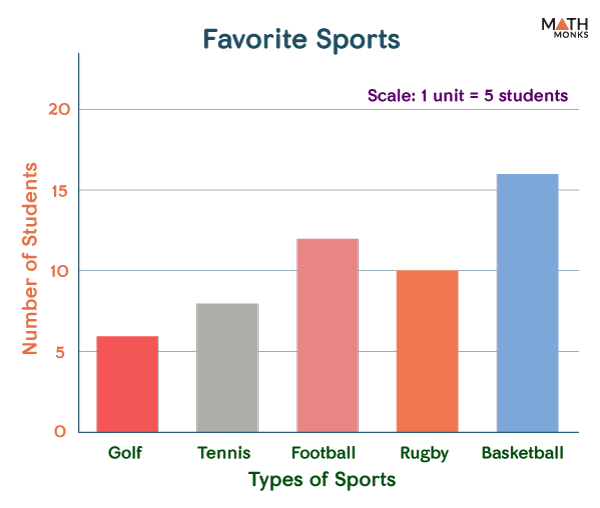
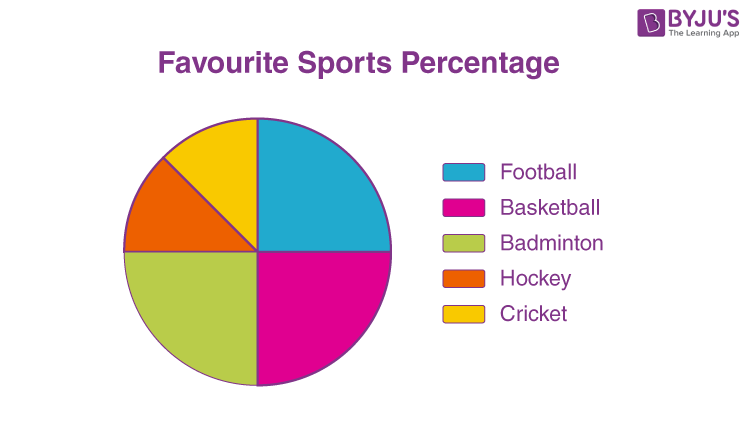
Data Intensive Graphs – Provide a Table
When your graph contains a lot of data, providing that data in a table format in addition will make the content accessible for a broader range of students. In the link below, you will find some helpful examples of “correct” and “incorrect” accessible graphs.
Below is a video that demonstrates how to include a table as an alternate format of a graph.
Additional Links
- How Can I Make My Images Accessible (University of Arizona)
- Beyond Basic Alt-Text – Charts, Maps, and Diagrams (Equidox)
- Accessible Complex Images (UW-Madison Information Technology)
- Digital Accessibility: Infographic Alt-Text (University of South Carolina)
- How to describe images (Poet Training Tool)
- Image Accessibility Creator (ASU EdPlus)
Discipline Specific Links
This section will continue to be developed as the unique needs of each department are identified and resources found to support your accessibility practice.
- Accessible Content: STEM (Northwestern Distance Learning) – this link has some examples for making STEM content accessible.
- Guidelines for Creating Image Descriptions (American Anthropological Association) – this has some concrete examples for those teaching anthropology, but may also be useful in other disciplines.
- Image Description Guidelines (Diagram Center) – this resource breaks it down by type of complex image and is very useful for those teaching in the arts or sciences.
Return to the top of this page
Click the back arrow or here to jump back to the Making Content Accessible at ARC page.